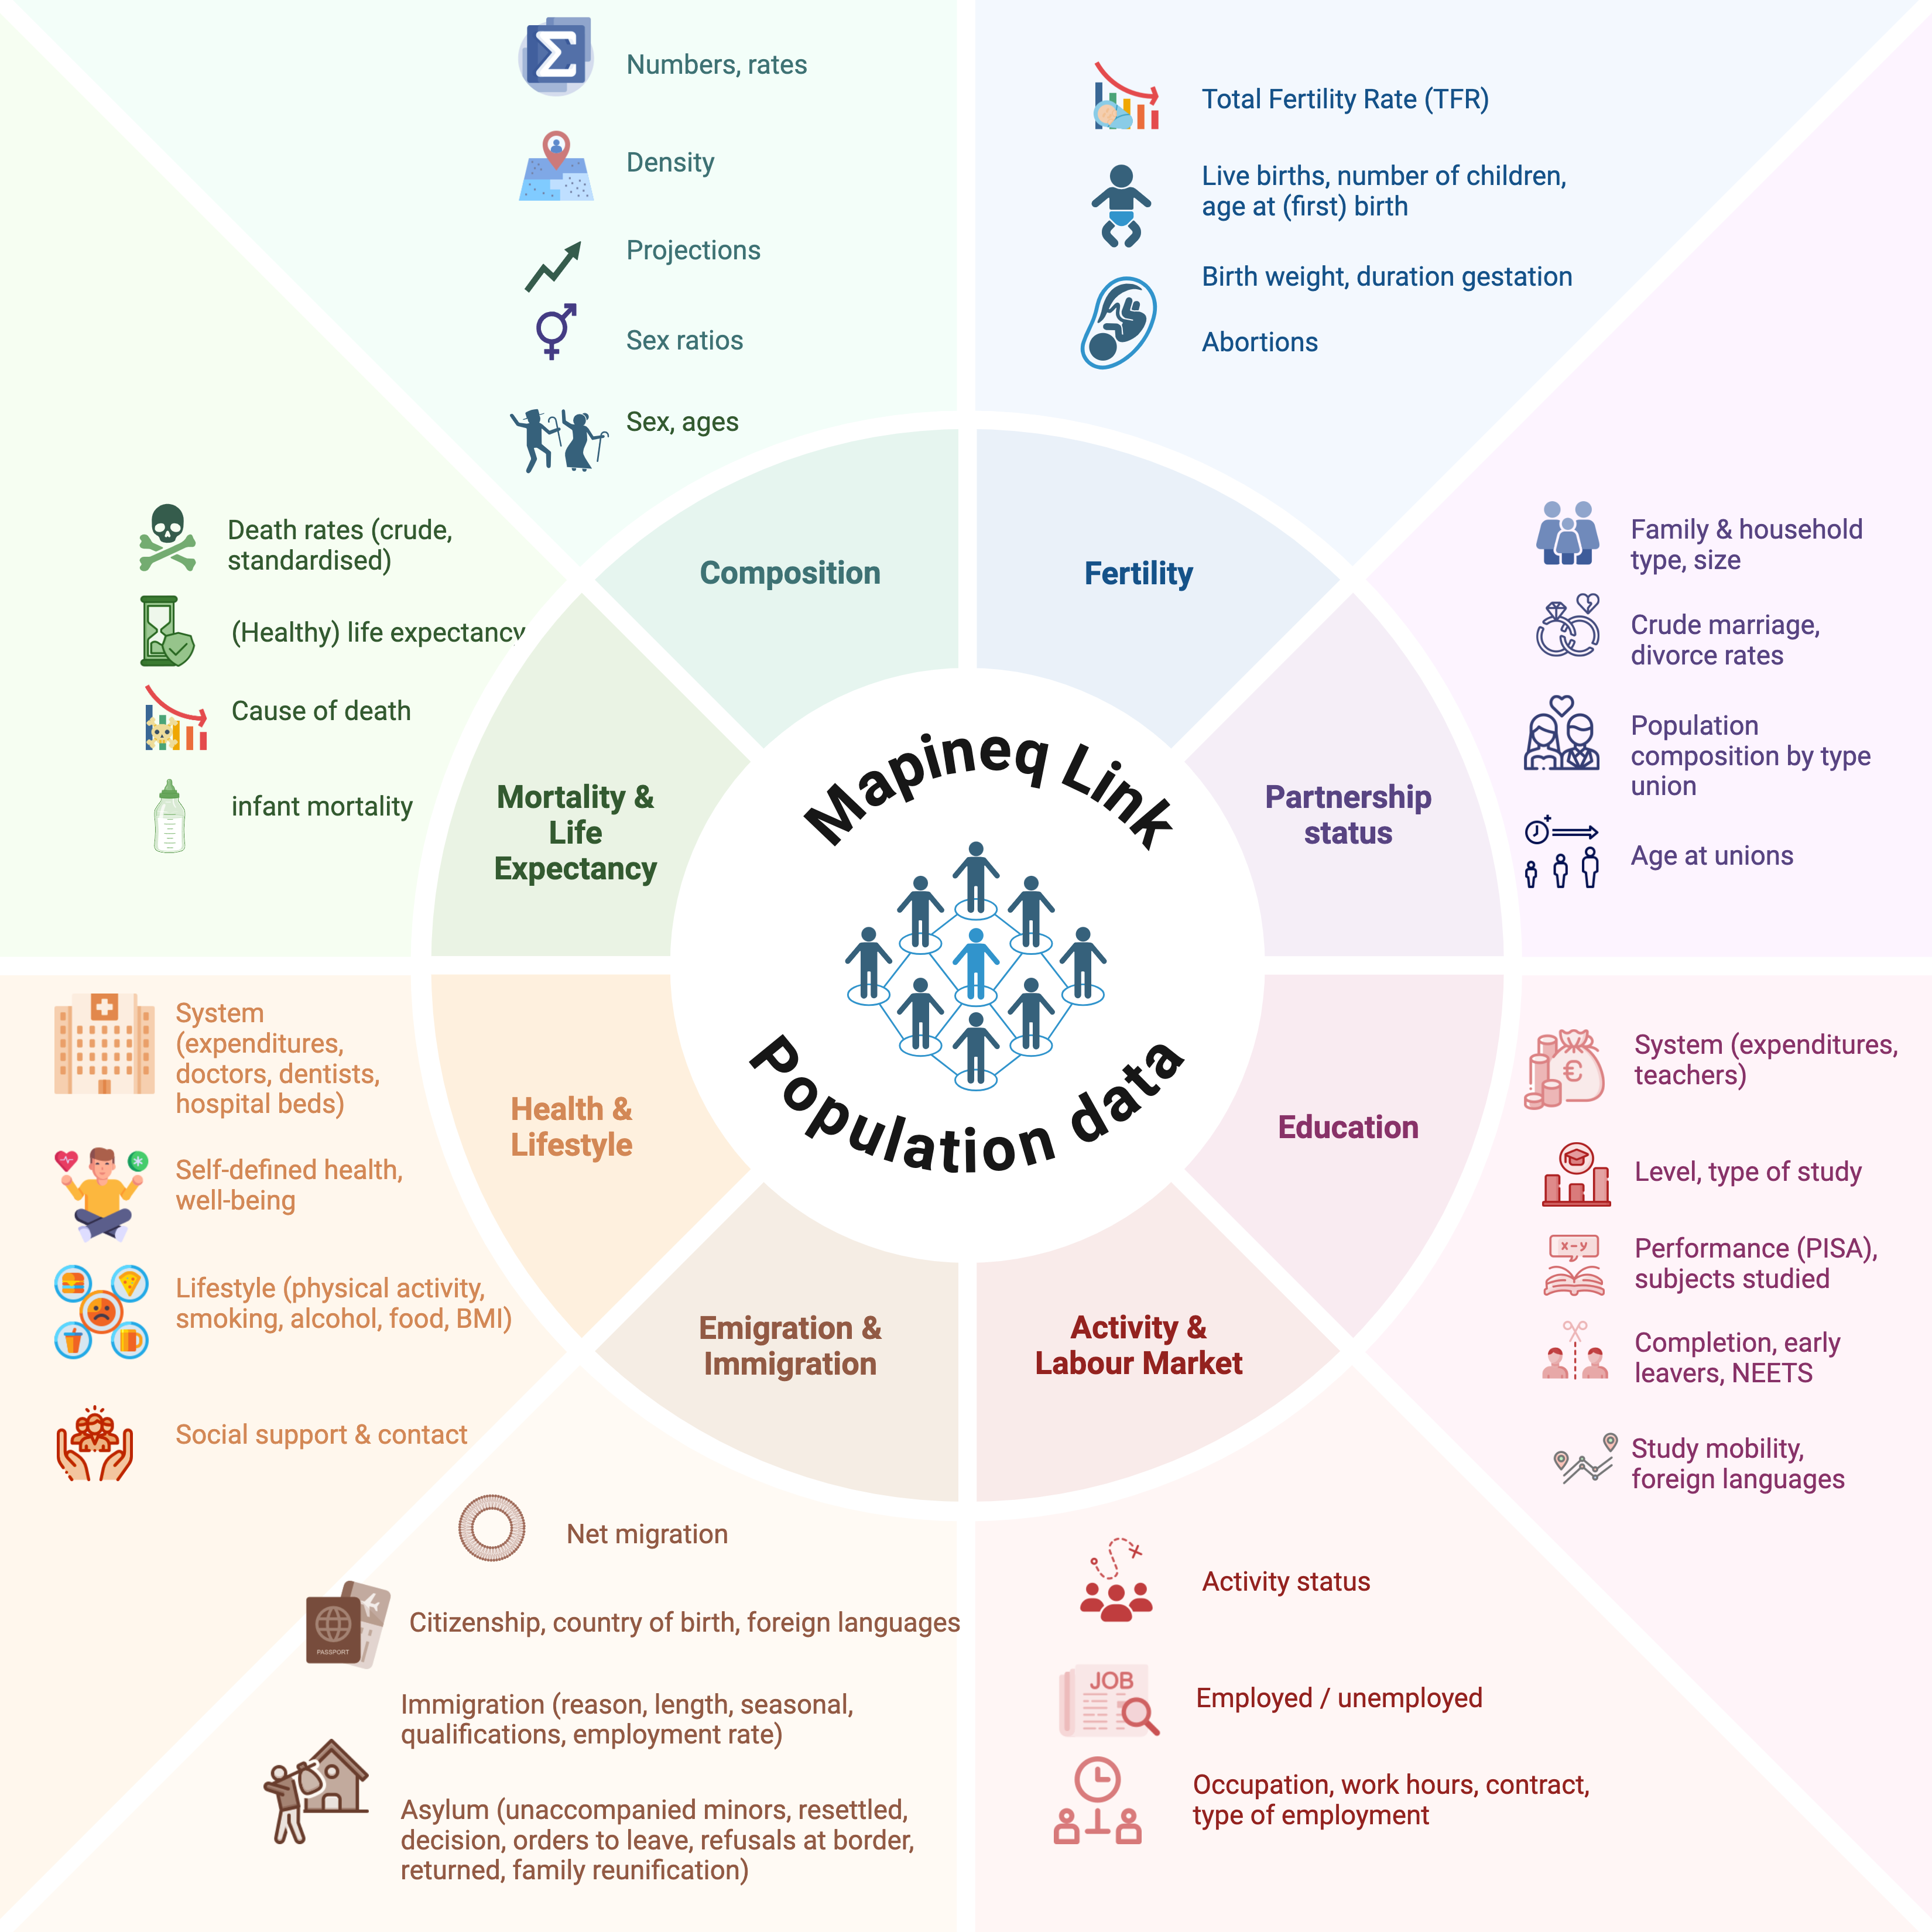
Ahead of Mapineq Link – an online interactive geospatial dashboard and database – launch later this year, the Leverhulme Centre for Demographic Science at the University of Oxford and University of Groningen team reveal the demographic, socioeconomic, health and lifestyle variables within the database.
Mapineq Link provides a unique open-access inequality database that supports the EU-funded Mapineq project in identifying geographically based trends and drivers of intergenerational, educational, labour market, and health inequalities over the life course in recent decades.
The latest Mapineq Link report outlines the national and subnational measures of the database which will be used in the interactive dashboard where users can explore geospatial patterns in key demographic, health, lifestyle and socioeconomic indicators.
This fourth report builds on the previous three modules that show how Mapineq Link uses institutional policy and structural indicators, incorporates environmental data, and integrates experimental and real-world data.

Professor Melinda Mills, senior author and Director of the Leverhulme Centre for Demographic Science and Demographic Science Unit at the University of Oxford, and Professor of Data Science and Public Health Policy at the University of Groningen, said, ‘We are excited for the launch of Mapineq Link, a crucial step towards a new equality of place. This groundbreaking mapping tool will provide insights needed to tackle local disparities and promote equality throughout the life course.’
Dr Douglas Leasure, Senior Researcher and Data Scientist at the Leverhulme Centre for Demographic Science and Demographic Science Unit said, ‘Mapineq Link’s interactive dashboard highlights local inequalities and helps to link them with potential drivers like differences in access to high-speed internet, enabling policymakers and stakeholders to visualise and address disparities at both local and national levels.’
Journalists, policymakers, researchers, advanced data scientists and other users of the dashboard will be able to access information on geospatially-linked structural and institutional policies. Users will also be able to examine how two indicators are related to each other and download the contextual data for their own use across a wide range of indicators. The Mapineq Link project adheres to FAIR principles, ensuring its innovations are Findable, Accessible, Interoperable, and Reusable for everyone.
Professor Melinda Mills and Dr Douglas Leasure will launch Mapineq Link’s interactive database and dashboard at a hybrid event on Monday 7 October 2024, registration is now open. Collaborators from Mapineq, the Einstein Center for Population Diversity, OECD and the German Federal Ministry for Economic Affairs and Climate Action will also speak at the event.
The report, ‘Mapineq Link: Demographic, socioeconomic, health and lifestyle indicators’, can be found on the Mapineq website.


